Big data: Everything you need to know

Big data, macro data, bulk data or data intelligence. There are multiple ways to refer to this element of industry 4.0 which, in recent years, has transcended in the technological field to capture the attention of multiple economic sectors.
However, there are still many companies, organizations and public and private institutions that are reluctant to abandon traditional analytical methods and incorporate big data and advanced statistical and machine learning methods into their decision-making processes.
There is a sea of data out there to exploit and it is the responsibility of each company to know how to best leverage this data to ensure business survival. Therefore, in this article we analyze the importance of big data, its different meanings, typologies and uses in the business world.
The importance of data intelligence
Data is not a new invention of this century. For many decades, its collection, organization, storage and analysis, based on the use of computers and databases, has served to record actions and simplify processes. This can be achieved at the click of a button, and has benefitted companies, institutions and global organizations.
However, the massive use of the internet and its evolution through the Internet of Things (IoT) have led to the development of a new digital ecosystem in the physical world, in which data plays a decisive role when predicting behavior and anticipating customer needs. To this we must add the advances in data storage and analysis, which have made it possible to capture, save and work with multiple data types.
Today, big data goes beyond the trail or imprint that each user leaves behind after using a web browser or the type of followers or “likes” registered on their different social network profiles. Google knows which product or service advertisements to show to each user, based on their tastes, preferences or interests. Online fashion giant Zalando offers product recommendations based on each customer’s purchase history. IKEA requests the postal code from all people who make a purchase in any of its stores as part of its sales strategy, allowing them to cross-check product sales with customer locations to find out which products are sold the most in a given geographical area. During the campaign for the US presidential elections in 2012, Barack Obama’s campaign manager, Jim Messina, created a project based on data mining and microtargeting techniques applied to political communication, with the intention of achieving presidential re-election. This was possible thanks to the creation of a gigantic database that Obama’s team of analysts had obtained after the 2008 campaign and whose data they thoroughly crossed, refined and structured. The database included information provided by party donors, pollsters, volunteers, and various Democratic Party files, as well as data collected from social media. All this data served to obtain personal information from potential voters that ranged from the most basic information such as age, sex or place of residence, to more complex facts such as their income level, political inclination, degree of electoral involvement, consumption profile, preferences or circle of personal relationships, etc.
All of these big data use cases are just a small sample of the value that data collection, storage, and analysis can have for any organization, regardless of its economic scope or size. Certain data can also be cataloged according to different criteria, as we will see later.
Definition of big data
The concept of big data was first coined in 1997, in an article published by NASA researchers Michael Cox and David Ellsworth, entitled Application-Controlled Demand Paging for Out-of-Core Visualization.
The publication explains that “ In the area of scientific visualization, input data sets are often very large” and how they “are expected to scale with the ability of supercomputers to generate them”. Likewise, the article underlines “visualization provides an interesting challenge for computer systems: data sets are generally quite large, taxing the capacities of main memory, local disk, and even remote disk. We call this the problem of big data”.
Subsequently, different companies, consulting firms and organizations have referred to the term “Big Data” in multiple ways. The McKinsey Global Institute, belonging to the global strategic consulting firm McKinsey & Company, used it for the first time in its report Big Data: The next frontier for innovation, competition and productivity (2011). This document points out how “the amount of data in our world has been exploding and analyzing large data sets—so-called big data—will become a key basis of competition, underpinning new waves of productivity growth, innovation, and consumer surplus”.
Shortly thereafter, Gartner published the Hype Cycle for Big Data (2012) analyzing the life cycle of Big Data, with the aim of helping companies develop strategies based on ever larger, faster and more varied data sets. Gartner refers to big data as “high-volume, high-velocity and/or high-variety information assets that demand cost-effective, innovative forms of information processing that enable enhanced insight, decision making, and process automation”.
Regarding, Forrester in its report The Big Deal about Big Data for Customer Engagement (2012) they explore the “ best practices for organizations seeking to leverage big data for improved customer engagement”. A term that Forrester defines as “the frontier of a firm’s ability to store, process, and access (SPA) all the data it needs to operate effectively, make decisions, reduce risks, and serve customers”.
All these references show that, although there is no full consensus when it comes to defining big data, as some talk purely about data and others mention the technologies used to convert that data into valuable information, there is no doubt about its value for organizations. Of particular benefit are its characteristics: volume, velocity, variety, veracity and the value of data, known as the five V’s of Big Data.
Types of big data:
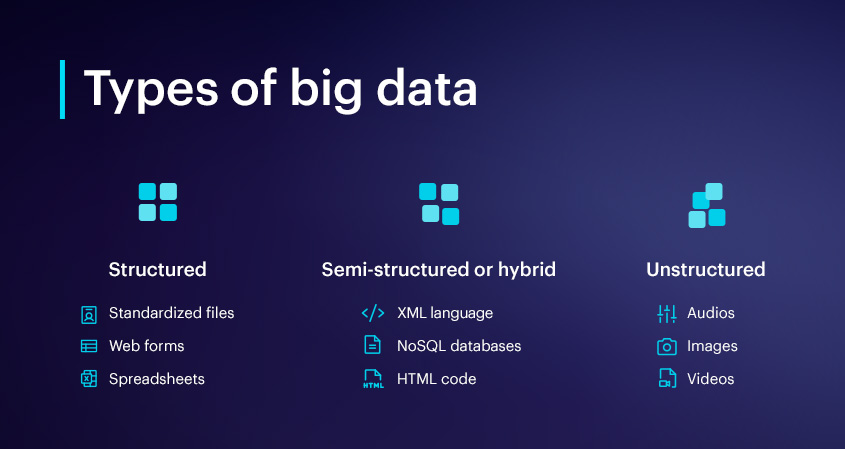
Within big data we can distinguish three different categories of data. Structured data, found in traditional databases; unstructured such as images, videos and emails; and, finally, semi-structured data that is halfway between the two previous types.
Structured: They have a predefined and fixed structure. Their storage is carried out in relational database table fields with predefined length, name and format. This reveals their organization, structure, type, positions and possible relationships in advance. Examples: Excel tables, spreadsheets, standardized customer files, user surveys about a product or service, etc.
Unstructured: In this category are data that do not have a predefined structure, nor are they stored in a table. Examples: Videos, audios, images, PDF files, text files, documents, visual presentations, emails, etc.
Semi-structured or hybrid: These are halfway between structured and unstructured since they contain properties from both categories. Although they do not have a fixed format, they are organized using labels and other markers to identify some of their elements. We find this type of data in text files created with HTML, XML or JSON languages. Examples: Web logs of internet connections and NoSQL databases.
Main uses of big data in the business world
The use of big data adds great value in dimensions such as operational efficiency, data monetization and decision making. However, customer experience and the opening of new business models are other areas where the use of big data can bring important business benefits, such as:
- Operational efficiency: big data is an essential tool when it comes to increasing the level of productivity and optimizing available resources, to achieve maximum profitability. The intelligent use and analysis of data not only makes it possible to increase transparency, optimize resource consumption and improve the quality of process performance, but also helps detect possible deviations, anomalies, and bottlenecks that conventional methods are not capable of diagnosing.
- Data monetization: the conversion of data into money is possible thanks to, for example, the union between big data and IoT. The incorporation of sensors in traditionally passive objects such as wearables, cars, light bulbs, household appliances, etc., has served to provide them with intelligent capabilities. Now these objects can collect data to be sent to processing centers, thanks to an interconnected network structure that also allows them to communicate with each other and transmit, compile and analyze data. In a more simplified way, IoT is a type of technology based on the connection of everyday objects to the Internet that aggregate, exchange and process information about their physical environment, in order to provide value-added services to end users. This large amount of captured data can be reused by companies, to improve the customer experience by offering more personalized services, improvements and updates. Likewise, the application of sensors in machines and objects in industrial environments, better known as Industrial Internet of Things (IIoT), helps to identify faults at any stage of production, capable of anticipating eventualities that may compromise systems and production equipment. It also contributes to having a constant and real-time control of the critical quality factors that affect the production line.
- Decision making: collecting data from customers helps companies improve the strategic decision-making process in all phases, from design, manufacturing and distribution to sales and after-sales service. The objective is to anticipate market trends and customer needs, to offer products and services with a high level of customization. This factor also includes the analysis of purchasing and consumption habits, the study of social behavior patterns at a massive level and the design of predictive models associated with the behavior of different customer profiles (consumers, voters, etc.).
- Customer experience: monitoring customer experiences through any contact channel, predicting preferences, and discovering trends that make it possible to detect possible variations in the preferences of different customer segments are some examples of how data can be used to improve the consumer experience.
- New business models: data collection and subsequent analysis can be used both to expand revenue streams from existing products and to create additional revenue streams from new products and services. Today we see how companies that have traditionally been associated with one sector are branching out into new sectors. Orange is a clear example of how a company based in the telecommunications sector can make the leap into the financial world, with its Orange Bank offering. Another example is the e-commerce leader Amazon, which has made its way into the technology sector with its cloud service Amazon Web Services (AWS).


